What a 'Peak Wait' Actually Measures, and What It Misses
A 70-minute peak and a 70-minute average are completely different problems. Here's how to read airport wait-time data without drawing the wrong conclusion.
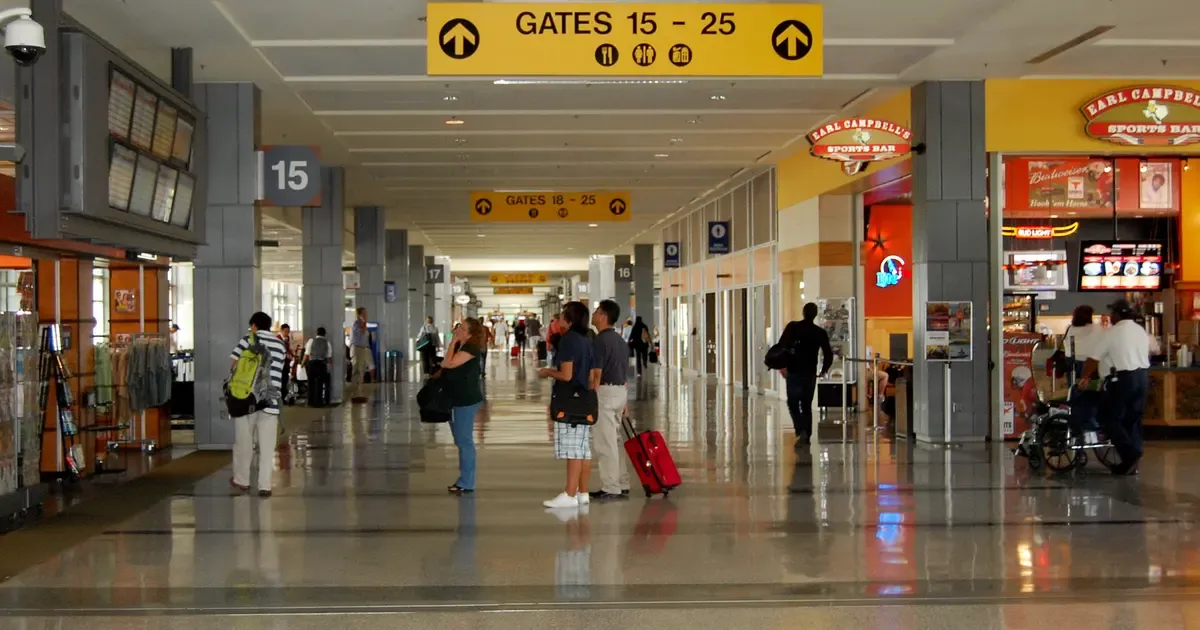
Tallahassee’s airport has a 120-minute peak wait. Its worst day averages 35.9 minutes. Both numbers are true, they describe the same week, and if you plan around the wrong one you’ll either miss a flight or waste two hours in a small terminal.
Wait-time data is genuinely useful. It’s also easy to misread, and the misreadings all go in predictable directions.
What does a peak wait actually measure?
The worst hour observed at that airport, in the standard screening lane.
That’s it. It’s not an average, not a median, and not what you personally will experience. Tallahassee’s 120-minute figure comes from Friday at 8 AM. The 7 AM and 9 AM hours both run 100 minutes, so it’s a genuinely bad three-hour block. But every other day at that airport tops out at 22 minutes or less, and TLH logs 83 hourly slots at five minutes or under.
So the 120 describes a real event that will genuinely happen to you if you fly out on a Friday morning, and describes nothing at all about the other 165 hours of the week.
Why does the daily average mislead in the other direction?
Because averaging across a full operating day buries the hours that matter.
Take LaGuardia. Its Sunday average is 17.7 minutes, which sounds like a mild inconvenience. Inside that same Sunday, the 2 PM hour hits 49 minutes, 3 PM hits 43, and 6 PM hits 34. Fourteen quiet hours are pulling the average down.
Two travelers on the same day at the same airport, one flying at 8 AM and one at 2 PM, have completely different trips. The average describes neither.
The rule I use: averages tell you what kind of airport this is. Peaks tell you what to do about your specific flight.
What does the quiet-slot count add?
It’s the number I find most underrated, and it answers a question the other two can’t: does this airport have anywhere to hide?
Chicago Midway logs 127 hourly slots at five minutes or under, with a peak of just 19 minutes on Monday at 7 AM. That airport is essentially frictionless. Des Moines logs 123 with a 10-minute peak. Washington Dulles logs 119 with a 19-minute peak.
Houston Intercontinental logs 12. LAX logs 10. JFK logs zero.
Those low numbers mean the checkpoint never empties. At JFK, there is no hour of the week where you walk up and go straight through — the daily averages run 17.6 to 22.1 and the best hour is still a real wait.
That changes your strategy completely. At Midway, moving your flight three hours can take you from a 19-minute wait to nothing. At JFK, moving your flight three hours takes you from 22 minutes to 18. The optimization isn’t available.
Which is better: a low peak or a flat profile?
For planning purposes, flat wins more often than people expect.
Dallas-Fort Worth runs 28 to 32 minutes across essentially the entire week, peaking at 32 on Thursday at 4 AM, Monday at 7 AM and Tuesday at 7 AM. It logs 23 quiet slots. That profile is never good — 30 minutes is a real wait — but it is never a surprise. You budget 30 minutes and you’re right every time.
Tallahassee averages far less and spikes to 120. You budget 20 minutes and you’re right six days a week and catastrophically wrong on the seventh.
The airport that ruins trips is not the one with the highest average. It’s the one where your expectation and the reality diverge.
You can compare the shapes directly on the Dallas, Tallahassee, Midway and Houston pages.
What does the peak number leave out entirely?
Everything except the queue, and the queue is often less than half your time.
Curb to checkpoint. At a large airport with remote parking and a shuttle, this is 20 to 30 minutes. At Buffalo or Asheville it’s five.
Checkpoint to gate. O’Hare and Dallas have genuinely long walks and inter-terminal transit. A small regional airport puts you at your gate in two minutes.
The boarding cutoff. The door closes 15 minutes before departure at most airlines, and up to 30 for international. That’s time you don’t have, subtracted from the front.
So a 30-minute peak wait at Houston, where the terminals are spread out and the parking is remote, costs you more total time than a 45-minute peak at Asheville, where you park 200 feet from the door.
How should I actually use these numbers?
Four steps, and it takes about two minutes per trip.
Find the peak for your specific hour, not your day. The hourly view is where the useful information is.
Check the quiet-slot count. High number means moving your flight is worth considering. Low number means don’t bother — there’s nowhere better to move to.
Add the airport’s physical overhead. Fifteen to thirty minutes for curb-to-checkpoint at a large airport, five to ten at a small one. Ten to twenty for checkpoint-to-gate.
Subtract the boarding cutoff from your departure time. That’s your real deadline.
The total is your minimum arrival. Whatever buffer you want on top of it is a separate decision about your own tolerance for risk.
What about the times the data is wrong?
It happens, and it’s worth knowing when to distrust it.
Wait-time patterns reflect a schedule. When the schedule changes — a new route, a seasonal shift, an airline moving terminals — the pattern moves with it, and historical data lags. Leisure destinations are the worst offenders here, because their summer and winter operations can be genuinely different airports.
Irregular operations break it entirely. A weather day, a system outage, a staffing shortage — none of that shows up in a normal-week pattern, and all of it can produce waits far outside anything in the data.
So: use the numbers to size your normal buffer. Don’t use them to justify cutting a buffer thin. The value of wait-time data is knowing when 90 minutes is genuinely enough and when it isn’t — not in shaving the last ten minutes off a plan.
For the official view of screening procedures and what’s actually happening in that line, TSA publishes its own guidance, and CBP does the same for customs if you’re planning around an international arrival.
Frequently asked questions
Does a peak wait mean I'll wait that long?
No. It's the worst hour recorded, and it applies to passengers in the standard lane during that specific hour. If you're flying at a different hour, or you have PreCheck, your wait is likely much shorter.
What's a quiet slot in wait-time data?
An hour where the maximum reported wait drops to five minutes or under. Counting them across a week tells you how much of the schedule is genuinely empty versus merely less busy.
Is a low average better than a low peak?
For most travelers, a predictable profile beats a low average with a big spike. Dallas-Fort Worth runs 28 to 32 minutes all week, which is never great and never a surprise — that's easier to plan around than an airport that's usually five minutes and occasionally 70.
How do I turn wait-time data into an arrival time?
Take the peak for your specific hour, add 15 minutes for the walk from curb to checkpoint, add 10 for the walk to your gate, and add the boarding cutoff of 15 to 30 minutes. That total is your minimum, not your buffer.
Sources
- TSA publishes its own guidance
Transportation Security Administration · tsa.gov
- CBP does the same for customs
U.S. Customs and Border Protection · cbp.gov
- Airline On-Time Performance Data
Bureau of Transportation Statistics · transtats.bts.gov
- Tallahassee Regional Airport official website
Tallahassee Regional Airport · talgov.com
Keep reading
 strategyTLHMDW
The Small Airport Advantage Is Real, But Not Where You Think
Small airports beat hubs on quiet hours, not on peak waits. Tallahassee peaks at 120 minutes. Here's how to read that tradeoff without getting it backwards.
FlyIndex Editorial strategyJFKLAX
How Early to Arrive: A Buffer Table for 20 US Airports
Two hours isn't a rule, it's an average of airports that behave nothing alike. Here's the buffer each one actually needs, built from real hourly data.
FlyIndex Editorial strategyORDMDW
The Second Airport Isn't Always the Shorter Line
Fort Lauderdale peaks at 69 minutes against Miami’s 46. Ontario beats LAX by 38. Here is when the alternate airport in your city actually saves you time.
FlyIndex Editorial